Bitcoin rally continues but all eyes on Ripple XRP – Welcome to this week’s retrospective of the latest goings-on in the crypto markets, featuring an overview of price movements, a look at the fundamentals, and the impact of other major events over the last week. The content of this article is for information purposes only and is not investment advice or any form of recommendation or invitation. Luno always advises you to obtain your own independent financial advice before investing or trading in cryptocurrency.
The good news ship rolls into another week, although it hasn’t all been plain sailing. The Bitcoin prices closed last week above the important $10,500 level – its highest weekly-close in over a year and a potentially important support level. On the flip side though, last week’s seeming unstoppable charge finally hit a wall at $12,000 over the weekend. In total $1.3 billion worth of open interest was liquidated across all crypto pairs during the correction, with BTC futures accounting for $735 million of the fall. The question now is whether bulls can muster another push through the resistance at the $12,000 mark.
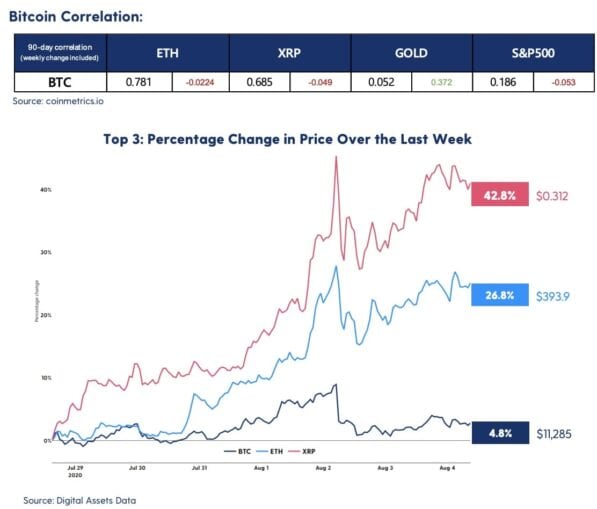
However, in general, BTC is looking technically strong. Trading volumes continue to rise and we’ve also seen an improvement in Bitcoin’s ability to scale (find out more on that later in this report). Elsewhere, altcoins are also enjoying strong gains. XRP has quietly been flying, seeing returns in excess of 40% over the past week. Ethereum too maintains its strong momentum, growing another 27% this week.
Price analysis
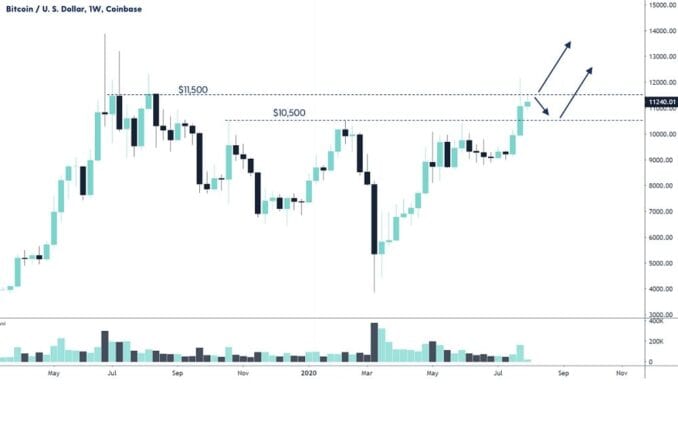
The bitcoin price managed to close last week above the important $10,500 level. This could potentially act as a new support level, and Sunday’s price dump saw the price drop down to exactly this level before it got bought up. Coincidental or not, flipping $10,500 from resistance to support is a clear bullish technical signal. We’re now trading just above $11,000 and the bulls are looking for a weekly close above $11,500. Another retest of the $10,500 level is not unlikely in the coming weeks, and bears are hoping for a weekly close below that level for more downside.
Volume approaching yearly highs
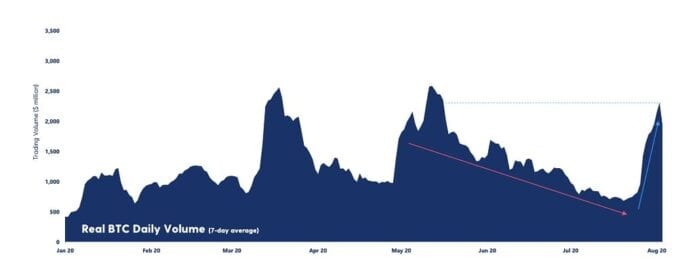
The real BTC daily trading volume has been growing strongly over the past week and is now approaching the yearly highs. As bitcoin started moving, we’ve seen several days with volume above $2 billion. We can certainly conclude that the almost 3-month long downwards trend has shifted upwards.
Volatility continues up after weekend dump
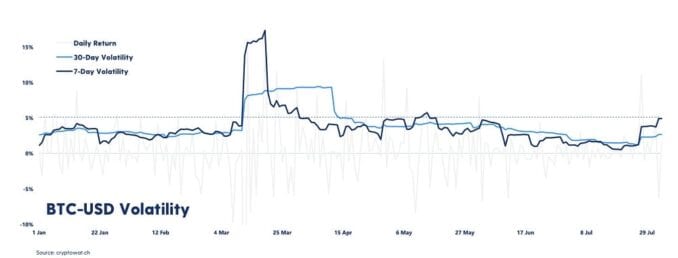
Bitcoin’s volatility has pushed further up over the last week, which will come as no surprise after the massive sell-off this weekend. The 7-day volatility is now approaching 5%. This is the highest level since the bitcoin halving at the beginning of May.
Sentiment drops down to “Greedy”
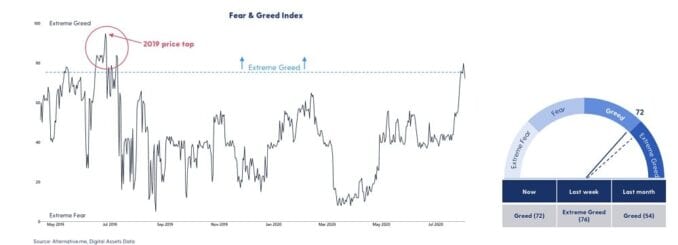
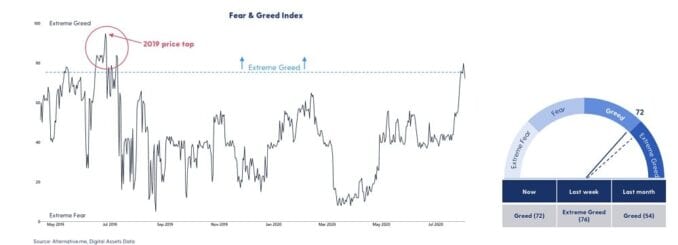
The Fear & Greed index has stayed in the “Extreme Greed” area this past week, but dropped down to “Greed” on Monday night. It even touched 80 before the dump this weekend. Investors should be aware; we usually don’t stay in this area too long and it has historically been an indication of a market top getting close. However, last time we pushed above 80 (15 June, 2019), the bitcoin price gained almost 50% in the next 10 days before topping out. Moreover, this indicator was not live during the massive bull run of late 2017.
Bitcoin on-chain scalability vastly improved since 2017
The blockchain activity on Bitcoin is approaching the high levels of December 2017. Active addresses are at their highest level since January 2018, while the daily transaction count is also ramping up. Interestingly though, the trading fees are significantly lower than in 2017. One of the key reasons is the implementation and adoption of SegWit. Digital Signature data typically accounts for 65 percent of the space in a transaction. SegWit removes this data from the transaction, enabling more transactions per block. Since the SegWit activation of August 2017, SegWit adoption has risen to around 50% of all transactions.
