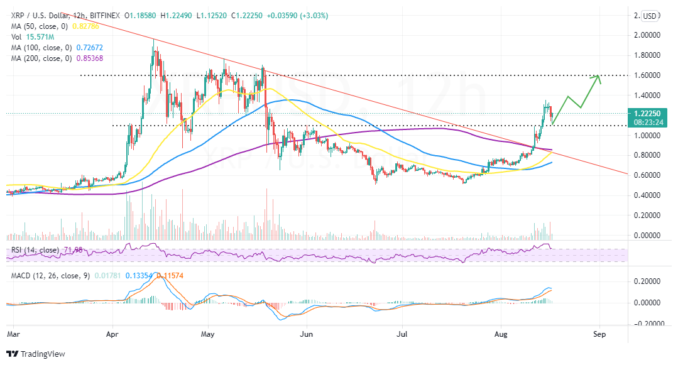
Ripple Price Analysis: Can XRP Rally To $2 After $1.1 Support Holds? – Ripple closed last week at $1.35, a move that had spurred investor interest and speculation for gains to $2. Nevertheless, a correction occurred with XRP losing some ground toward $1. Support at $1.1 plays a crucial role in ensuring that losses were mitigated, but data by CoinGecko shows that Ripple is trading 7.4% lower in 24 hours.
Ripple Price Recoils after Support at $1.1
The cross-border money transfer token currently teeters at $1.2 as bulls focus on lifting above $1.4 in the near term. According to the Relative Strength Index (RSI), bulls could have salvaged the situation, preventing continued correction.
Currently, the RSI, which follows the trend of an asset and measures its strength, is holding at 70. As it resumes movement into the overbought region, XRP is expected to lift higher.
Intriguingly, the 50 Simple Moving Average (SMA) may cross above the 200 SMA in the coming sessions, as per the 12 hours chart. Although this indicator is not a golden cross, it often ascertains a move north. Therefore, it could trigger another firm bullish grip as buyers take on $1.4 and $1.6 barriers.
XRP/USD 12-Hour Chart

It is worth mentioning that traders should be aware Ripple’s anticipated upswing may fail to occur, especially if the Moving Average Convergence Divergence (MACD) indicator flips bearish in the coming sessions. According to the exact timeframe, a sell signal is in the offing. The odds for an extended correction would increase as soon as the 12-day exponential moving average (EMA) crosses below the 26-day EMA.
The MACD tracks Ripple’s trend and calculates its momentum. A move toward the mean line reinforced the bearish outlook. Hence, it is one of the most crucial trend indicators, especially when identifying entry and exit positions.
Ripple Intraday Levels
- Spot rate: $1.21
- Trend: Bullish
- Volatility: Expanding
- Resistance: $1.4 and $1.6
- Support: $1.1 and $1


